
















Umme Khansa
About me
My name is Umme Khansa. I have recently completed my BCA from Integral University.
I have completed an internship at Cyient as a Software Engineer Intern where I worked on an Employee Utilization Dashboard using Power BI. During the internship, I worked with Power Query, DAX, Excel, and SQL to create interactive dashboards and KPI reports.
I have also developed projects like Regional Profitability Dashboard, Executive Financial Intelligence Dashboard, Netflix Content Analysis Dashboard and Final Year Project: Predictive Healthcare Management System Based on IOMT Data on Power BI.
My strengths are quick learning ability, communication skills, teamwork, and presentation skills. I am looking for an opportunity where I can improve my technical skills and grow professionally in the IT industry.”
Photos

Work Experience
Education
Projects
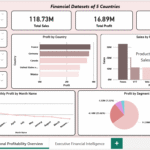
Financial Datasets of 5 Countries
Project 1A: Regional Profitability Dashboard Created a dashboard for 95 countries using Power BI to visualize sales, profit, and margin data. Implemented DAX measures to calculate KPIs and monthly sales trends. Enabled dynamic filtering (Country, Segment, Month, Discount Band) for in-depth analysis. Project 1B: Executive Financial Intelligence Dashboard Developed executive-level Power BI visuals (bar, pie, line charts) to analyze profitability and trends. Applied DAX to measure segment-wise KPIs. Interactive filters allowed real-time executive data exploration. Tools Used: Power BI, DAX, Excel
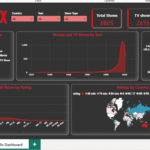
Netflix Content Analysis
Built an analytical dashboard on Netflix’s global content catalog. Tracked metrics like title counts, directors, ratings, and content growth over years. Used DAX for custom KPIs and slicers for dynamic filtering by Year, Country, Show Type.